This week I wanted to talk about how to use Safari’s Developer Tools with Simulators or iOS devices in Safari or in your application’s web views. This is something that can be extremely helpful when working in web applications or in apps that have a mixture of web and native content as do ours at Cerner.
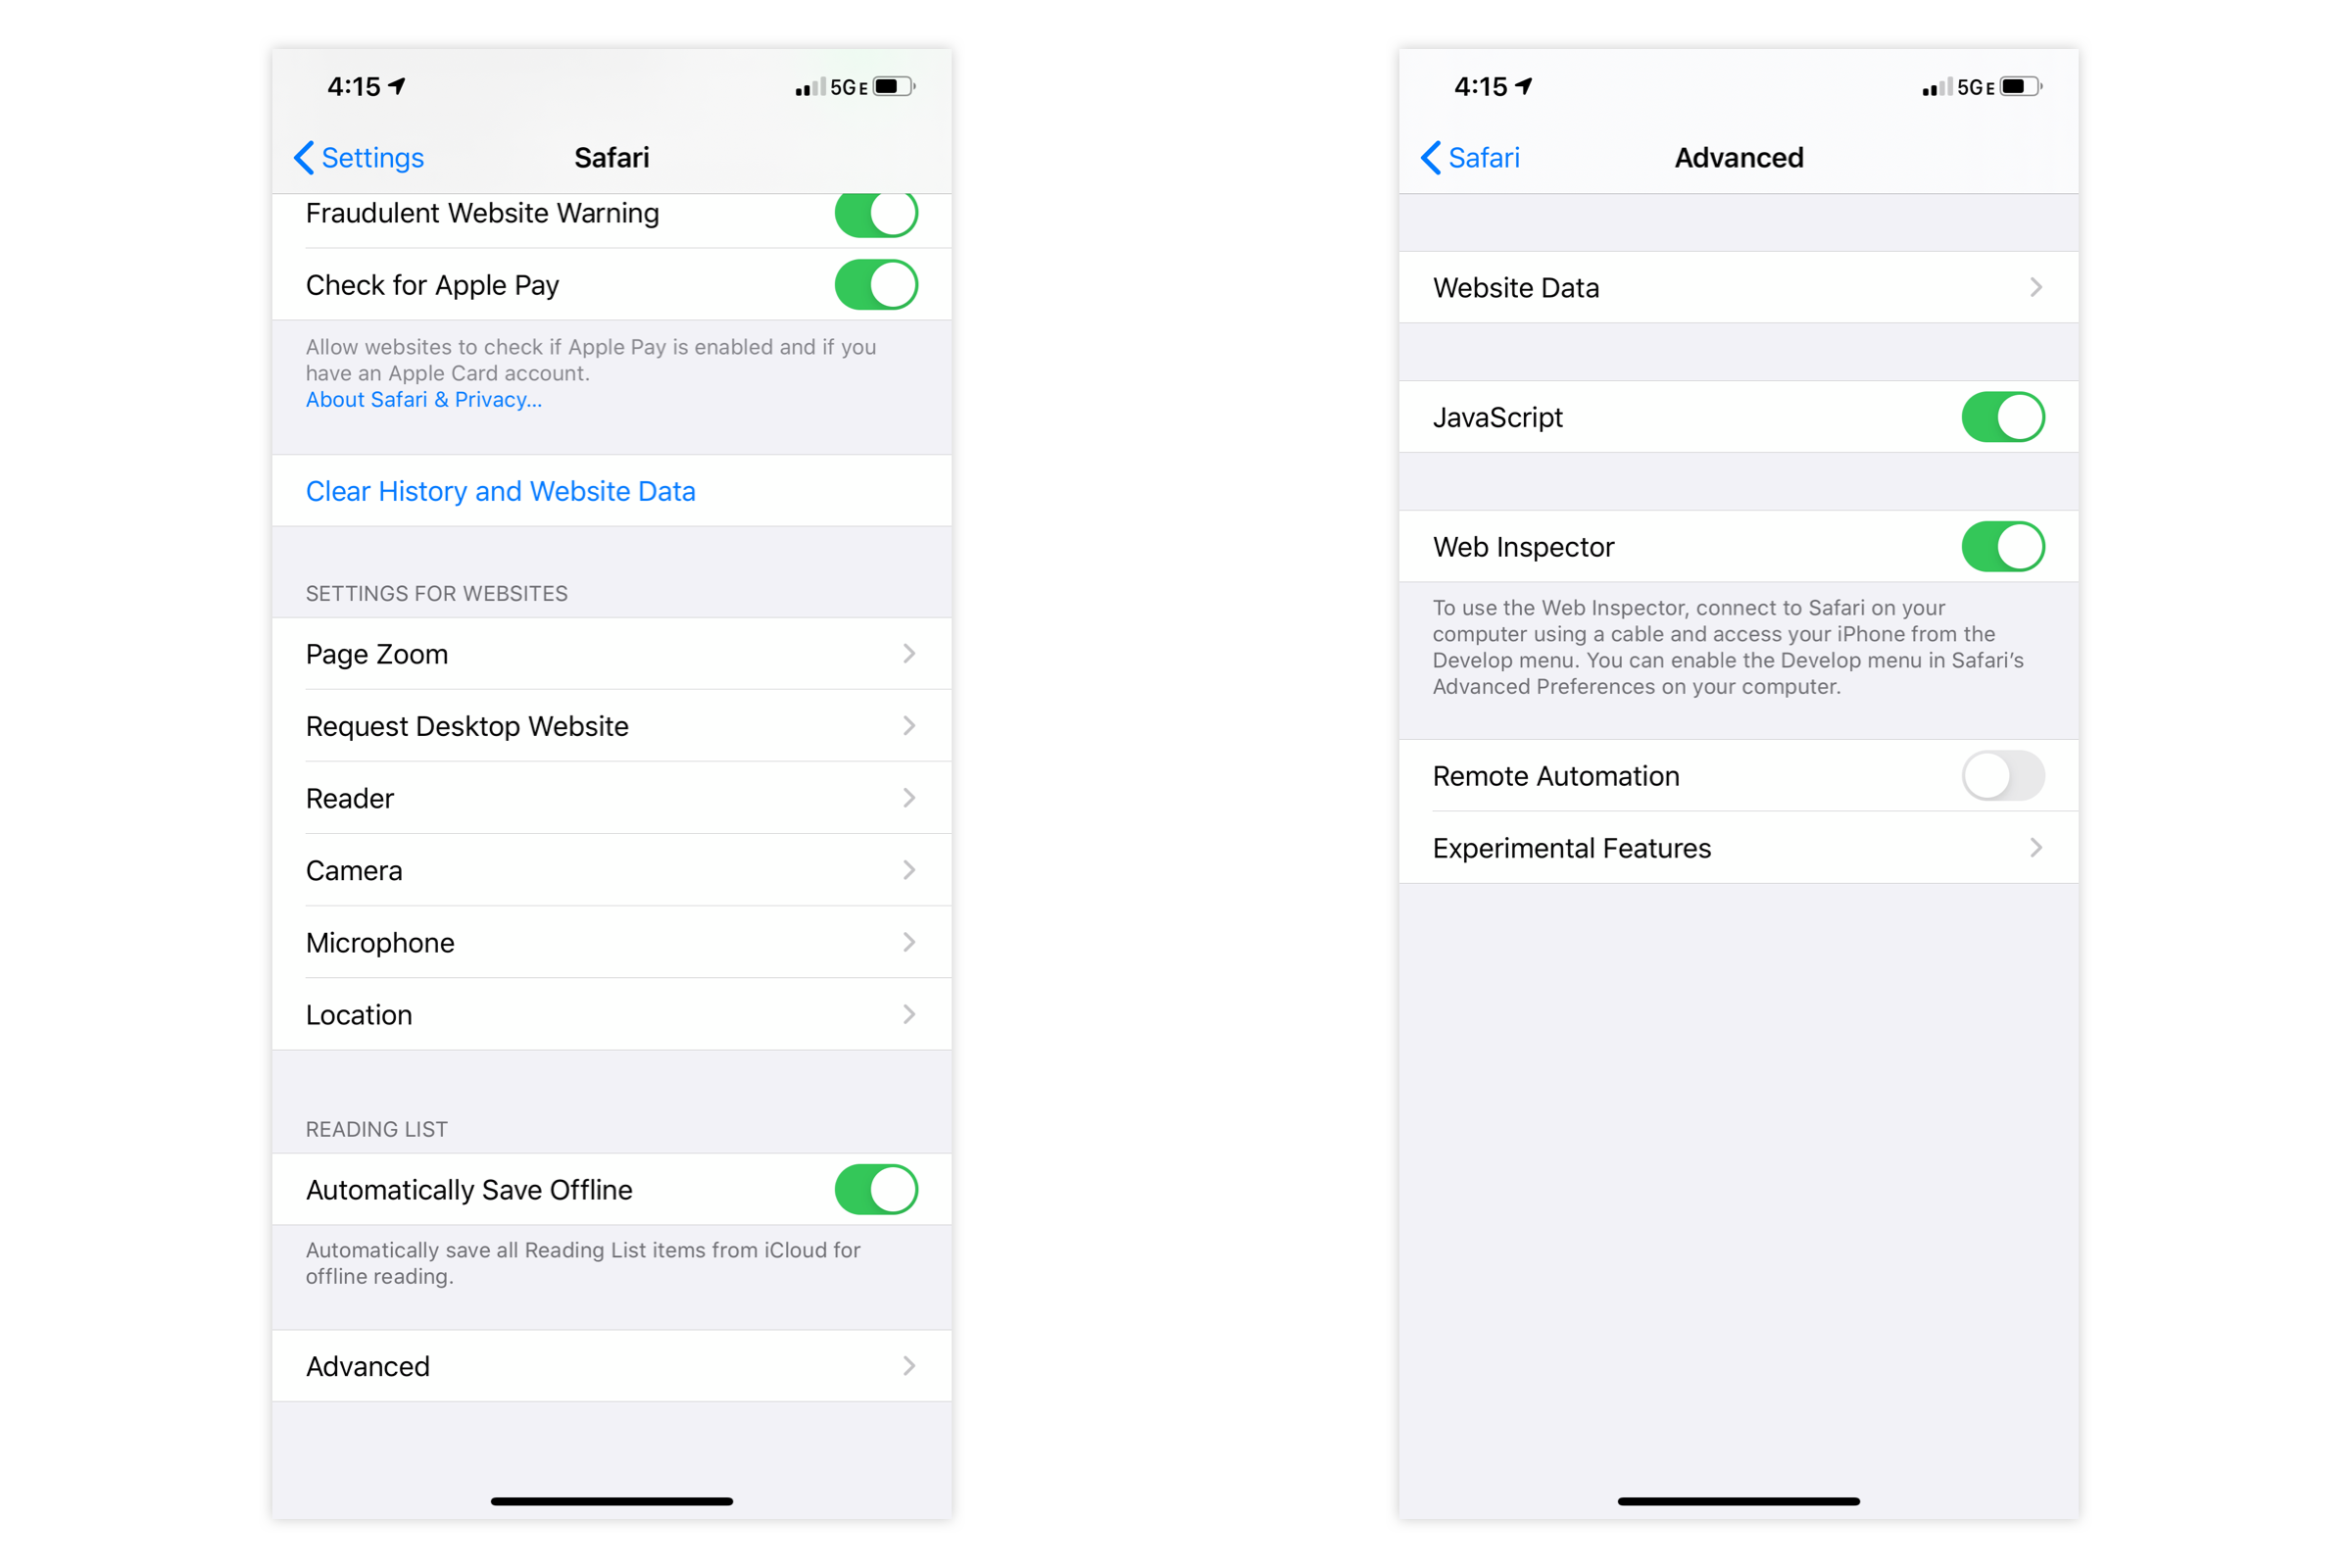
Enabling Safari Debugging If you are on a real device you will need to enable the Web Inspector first. Open Settings, then open Safari, scroll to the bottom and open Advanced. You should see an option for Web Inspector, enable this and you will see your phone as an option in the Develop menu item.
If you are using a simulator, there is no setup after enabling the Develop mode in Safari.
Enabling the Develop Menu Item
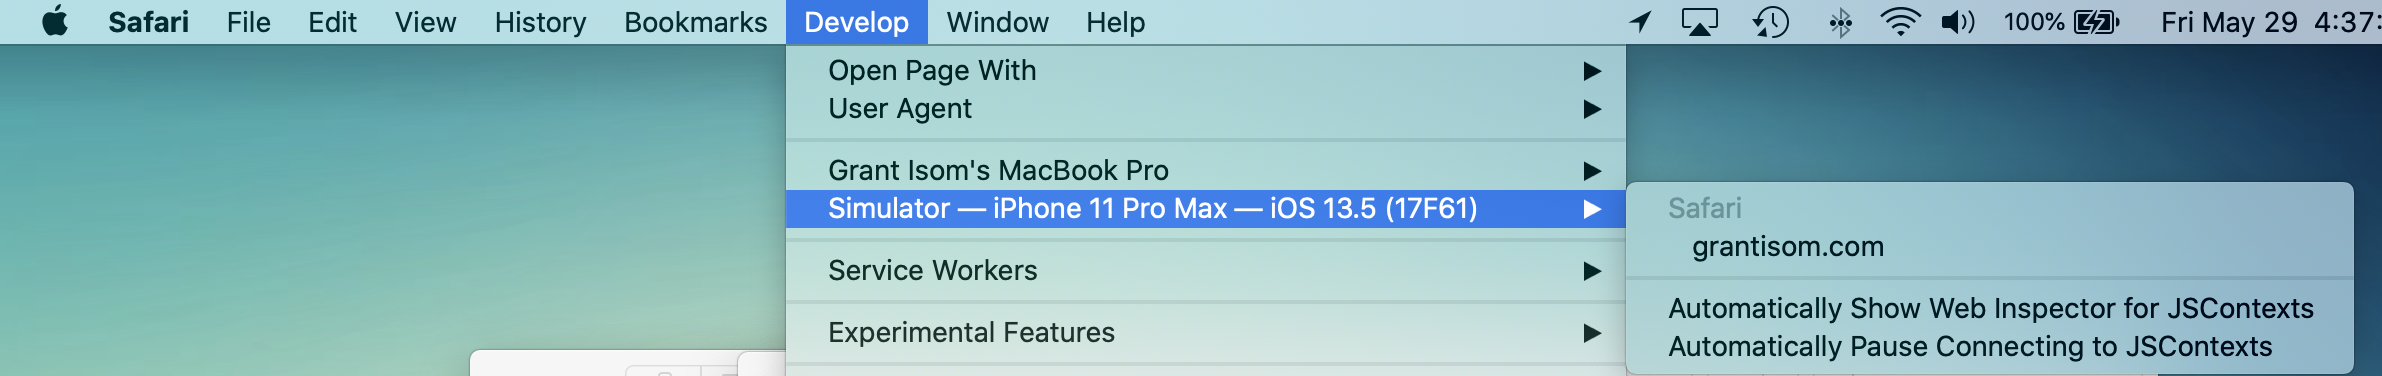
In Safari you will need to enable the Develop menu item before you can see any other available devices for inspection. Open Preferences ⌘ + , and open the Advanced section. At the bottom, check the box next to “Show Develop menu in menu bar”. Now you should see the Develop menu item and can chose web views or browser tabs to inspect on real devices or simulators!
You are now all set! You can interact with the web inspector just like you can in Desktop Safari. The only caveat is that this will not work for apps that are from TestFlight or the App Store, so debug mode only. Hope this helps and happy coding!